
80
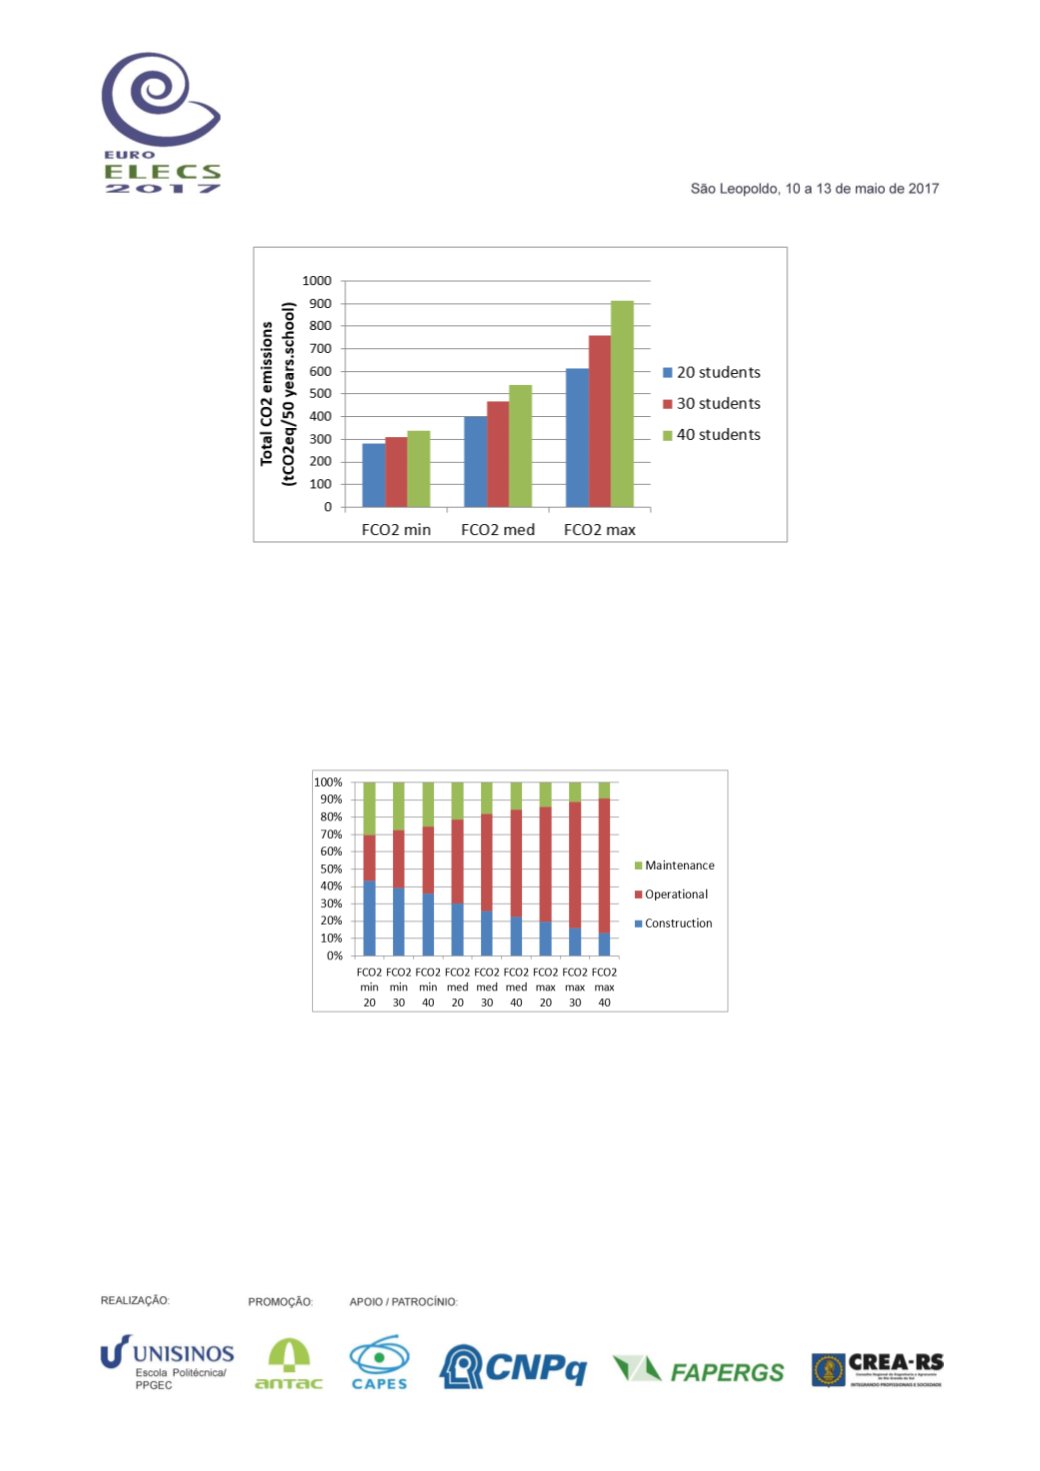
Figure 5.
Total CO
2eq
emissions in school life cycle
The CO
2eq
emissions from the construction phase was calculated and was found to be 121.61
tCO
2eq
/school. A great difference between FCO
2min
and FCO
2max
can be observed in Figure 5.
There is a difference of around 270% between the scenario with 40 students using FCO
2min
and
FCO
2max.
In this sense, it is very important to account the correct density and an adequate FCO
2
(according to the objective of the study) or use of different scenarios (as it was done in this study)
for this kind of buildings. The differences found in this research are significant, which may lead to
false conclusions depending on the data used and the purpose of the study.
Figure 6.
Participation of construction, maintenance and operational phases in CO
2eq
emissions life cycle
Figure 6 shows the difference of phase participation in CO
2eq
life cycle, according to the
occupational rate and CO
2eq
emission factor. The construction phase participation ranged from 13
to 43%, the operational phase from 27 to 77% and the maintenance from 9 to 30%. According to
these results the construction phase has more impact than operational phase for fewer students.
Few students result in a lower occupational rate in classrooms, which leads to lower energy
consumption for artificial conditioning and CO
2eq
emissions, decreasing the participation of
operational phase and at the same time increasing the construction and maintenance phase’s
participation.
Therefore, we know that Brazilian municipal schools tend to have a high occupational rate, the
operational phase presents itself as the most impacting phase in the life cycle, as assumed in this


